(Python)複数種のライフゲームをmatplotlib+gif出力
前書き
ライフゲーム(Conway’s Game of Life)はセルオートマトンの一種です。
一次元のセルオートマトンにはシェルピンスキーのタイルが含まれます。Pythonでの実装例は[(Python)二項定理・パスカルの三角形をprintする]をご参照ください。
ライフゲームは以下のルールで進みます(参考:ライフゲーム - Wikipedia)。
なお、0, 1は以下のことを示すとします
- 0: 死亡
- 1: 生存
| イベント | 元のセル | 生存セルの隣接 | 結果 |
|---|---|---|---|
| 誕生 | 0 | 3 | 1 |
| 生存 | 1 | 2~3 | 1 |
| 過疎 | 1 | ≦1 | 0 |
| 過密 | 1 | ≧4 | 0 |
ちなみに、どのようなものかをすぐに見たい方は、Googleで「life game」と検索してみてください。 検索結果のページでゲームが開始されます。
方法
以下ではPython, numpy, matplotlibを用いた、Google Colaboratory上でのライフゲームの作り方について一例を示します。
プログラムの流れは以下の通りです。
- プロットの設定
- X, Yの範囲を指定
- Zとしてランダムな整数値を用意
- 以下をフレーム数分ループ
- 次世代としてZをコピー
- pcolormeshとしてプロット
- 次世代のZについてイベント処理
- アニメーションとして書き出す
- gifファイルとしてセーブ
作業前にドライブをマウントしておきましょう。
from google.colab import drive
drive.mount('/gdrive')
実行後に得られるURLからページを進んでいき、許可するためのキーを取得してボックスに貼り付けます。
結果
一種の場合
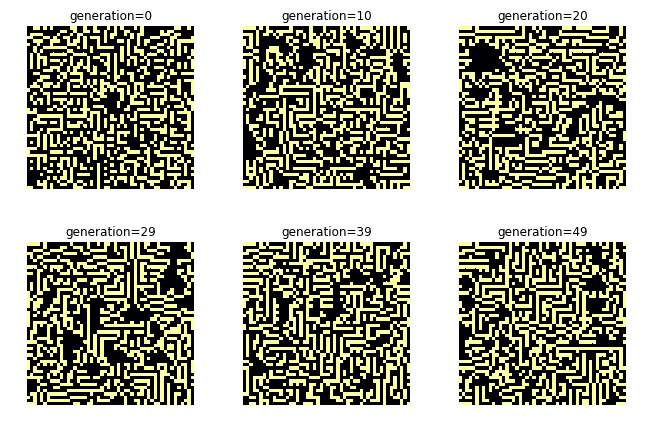
まずはシンプルに一種類の生物がいる場合のみを作成します。
Colormap(後述)にinfernoを使っているため、数値が高いほど明るく(白く)見えます。 数値と色の対応は以下の通りです。
- 黒: 死亡(0)
- 黄: 生存(1)
# one species
import matplotlib.pyplot as plt
import numpy as np
from matplotlib.animation import FuncAnimation as fca

fig, ax = plt.subplots(figsize=(3, 3))
ax.axis("off")

X, Y    = np.mgrid[0:51, 0:51]
Z       = np.random.randint(0, 2, X.shape)

def plot(frame):
    Zn = Z # 次世代(Zのコピー)
    plt.title('generation={}'.format(frame))
    mesh = ax.pcolormesh(X, Y, Zn, cmap="inferno")
    for i in range(len(Z)): # 行数ループ
        if i == len(Z)-1: continue #プロット端はスキップ
        else:
            for j in range(len(Z)): # 列数ループ
                if (j == len(Z)-1): continue #プロット端はスキップ
                sr = (Z[i-1, j-1] + Z[i-1, j] + Z[i-1, j+1] +
                      Z[i, j-1]               + Z[i, j+1]   +
                      Z[i+1, j-1] + Z[i+1, j] + Z[i+1, j+1]) # surround cell sum
                nc =  Z[i, j] # now cell
                if   (sr == 3 and nc == 0): Zn[i, j] = 1 # 誕生
                elif (sr == 2 and nc == 1): Zn[i, j] = 1 # 生存
                elif (sr == 3 and nc == 1): Zn[i, j] = 1
                elif (sr <= 1 and nc == 1): Zn[i, j] = 0 # 過疎
                elif (sr >= 4 and nc == 1): Zn[i, j] = 0 # 過密
                else: pass

a = fca(fig, plot, frames=50)
a.save("/gdrive/My Drive/lg_one-species.gif", writer="pillow", fps=10)

- ランダムな配置であるためか通常のライフゲームとは異なる動きを示した。
- 直線的な生存セルのつながりが見られた。
二種の場合
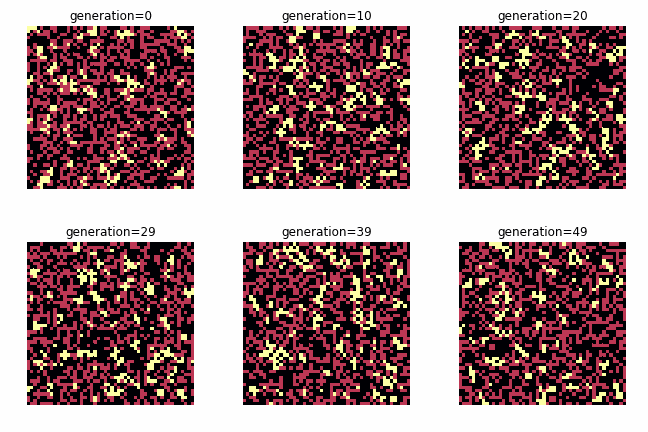
次に二種類の生物がいる場合のみを作成します。
- 黒: 死亡(0)
- 赤: 第一種生存(1)
- 黄: 第二種生存(2)
この場合の生存などのイベントの条件は経験的な数値(マジックナンバー)で設定していますので、任意の値を入れてみて下さい。
# two species
import matplotlib.pyplot as plt
import numpy as np
from matplotlib.animation import FuncAnimation as fca

fig, ax = plt.subplots(figsize=(3, 3))
ax.axis("off")

X, Y    = np.mgrid[0:51, 0:51]
Z       = np.random.randint(0, 2, X.shape)

def plot(frame):
    Zn = Z # 次世代(Zのコピー)
    plt.title('generation={}'.format(frame))
    mesh = ax.pcolormesh(X, Y, Zn, cmap="inferno")
    for i in range(len(Z)): # 行数ループ
        if i == len(Z)-1: continue #プロット端はスキップ
        else:
            for j in range(len(Z)): # 列数ループ
                if (j == len(Z)-1): continue #プロット端はスキップ
                sr = (Z[i-1, j-1] + Z[i-1, j] + Z[i-1, j+1] +
                      Z[i, j-1]               + Z[i, j+1]   +
                      Z[i+1, j-1] + Z[i+1, j] + Z[i+1, j+1]) # surround cell sum
                nc =  Z[i, j] # now cell
                if   (sr ==  2 and nc == 0): Zn[i, j] = 1 # 誕生
                elif (sr ==  3 and nc == 0): Zn[i, j] = 1
                elif (sr ==  6 and nc == 1): Zn[i, j] = 2 # 変異
                elif (sr ==  8 and nc == 1): Zn[i, j] = 2
                elif (sr == 10 and nc == 1): Zn[i, j] = 2
                elif (sr <=  3 and nc == 1): Zn[i, j] = 0 # 過疎
                elif (sr <=  6 and nc == 2): Zn[i, j] = 0
                elif (sr >= 10 and nc == 1): Zn[i, j] = 0 # 過密
                elif (sr >= 12 and nc == 2): Zn[i, j] = 0
                else: pass

a = fca(fig, plot, frames=50)
a.save("/gdrive/My Drive/lg_two-species.gif", writer="pillow", fps=10)

- おたがいの種が一定の数を保ちながら生存を続けた。
カラーバリエーション
matplotlibではColormapsとしてカラーバリエーションが選べます(参考:Choosing Colormaps in Matplotlib — Matplotlib 3.4.2 documentation)。
# two species, multiple colors
import matplotlib.pyplot as plt
import numpy as np
from matplotlib.animation import FuncAnimation as fca

fig, axs = plt.subplots(2, 2, figsize=(3, 3))
axs[0, 0].axis("off")
axs[0, 1].axis("off")
axs[1, 0].axis("off")
axs[1, 1].axis("off")

X, Y    = np.mgrid[0:51, 0:51]
Z       = np.random.randint(0, 2, X.shape)

def plot(frame):
    Zn = Z # 次世代(Zのコピー)
    mesh = axs[0, 0].pcolormesh(X, Y, Zn, cmap="inferno")
    mesh = axs[0, 1].pcolormesh(X, Y, Zn, cmap="viridis")
    mesh = axs[1, 0].pcolormesh(X, Y, Zn, cmap="cividis")
    mesh = axs[1, 1].pcolormesh(X, Y, Zn, cmap="gnuplot")
    for i in range(len(Z)): # 行数ループ
        if i == len(Z)-1: continue #プロット端はスキップ
        else:
            for j in range(len(Z)): # 列数ループ
                if (j == len(Z)-1): continue #プロット端はスキップ
                sr = (Z[i-1, j-1] + Z[i-1, j] + Z[i-1, j+1] +
                      Z[i, j-1]               + Z[i, j+1]   +
                      Z[i+1, j-1] + Z[i+1, j] + Z[i+1, j+1]) # surround cell sum
                nc =  Z[i, j] # now cell
                if   (sr ==  2 and nc == 0): Zn[i, j] = 1 # 誕生
                elif (sr ==  3 and nc == 0): Zn[i, j] = 1
                elif (sr ==  6 and nc == 1): Zn[i, j] = 2 # 変異
                elif (sr ==  8 and nc == 1): Zn[i, j] = 2
                elif (sr == 10 and nc == 1): Zn[i, j] = 2
                elif (sr <=  3 and nc == 1): Zn[i, j] = 0 # 過疎
                elif (sr <=  6 and nc == 2): Zn[i, j] = 0
                elif (sr >= 10 and nc == 1): Zn[i, j] = 0 # 過密
                elif (sr >= 12 and nc == 2): Zn[i, j] = 0
                else: pass

a = fca(fig, plot, frames=50)
a.save("/gdrive/My Drive/lg_two-species_multi-color.gif", writer="pillow", fps=10)
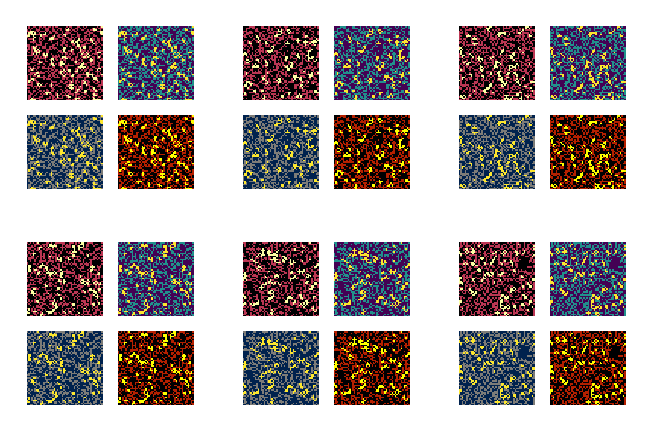
今回は以下の配置で4種のカラーマップを試しました。
| inferno | viridis |
|---|---|
| cividis | gnuplot |

ぜひ様々なカラーを試してみて下さい。
Youtubeにも投稿してみました。動画による出力は[(Python)Google Colabでライフゲームをmp4出力]をご参照ください。
関連記事: